1. Introduction
OPeNDAP is the developer of client/server software, of the same name, that enables scientists to share data more easily over the internet. The OPeNDAP group is also the original developer of the Data Access Protocol 2.0 (DAP2), and the much modern Data Access Protocol 4 (DAP4) that the software uses. Many other groups have adopted DAP and provide compatible clients, servers, and SDKs. OPeNDAP’s DAP is also a NASA community standard. For the rest of this document, "OPeNDAP" will refer to the software.
With OPeNDAP, you can access data using an OPeNDAP URL of any database server that supports OPeNDAP. You can do this via command-line, Internet browser, or a custom UI. You can also use other NetCDF compliant tools, such as PyDAP/Python, Matlab, R, IDL, IDV, and Panoply.
|
Note
|
OPeNDAP data is, by default, stored and transmitted in binary form. In addition to its native data representation format, OPeNDAP can get data in the following formats: NetCDF3 (classic), NetCDF4 (enhanced), GeoTIFF, JPEG2000, JSON, ASCII. |
This quick start guide covers how to use OPeNDAP in a typical web browser, such as Firefox, Chrome, or Safari, to discover information about data that is useful when creating database queries. For additional information, see the OPeNDAP User Guide.
1.1. Key Terms
-
Hyrax: The server half of OPeNDAP, developed by the OPeNDAP group.
-
OPeNDAP URL An OPeNDAP URL is a URL that includes "opendap.org" and enables you to access data on a database server on which OPeNDAP is implemented.
-
DAP (Data Access Protocol): A data transmission protocol designed by OPeNDAP specifically for sciencific data. The protocol relies on the widely used and stable HTTP and MIME standards and provides data types to accommodate gridded data, relational data, and time series, as well as allowing users to define their own data types.
-
Constraint Expressions (CEs): Criteria that limits/subsets what data is returned from a remote database. Because most databases will have far more data than you want, you’ll want to find out something out about the data and then use that information to constrain your queries. Any subsetting as a result to CEs takes place close to the data.
-
DMR (Dataset Metadata Response): This is single XML file used in the DAP4 protocol, that provides information about the data file such as: variable names, their types, sizes, dimensions, and many other attributes. A client that parses the DMR can create remote Dataset objects that accurately describe the data file, without openning nor downloding any remote data (lazy reads).
-
DDS (Dataset Descriptor Structure): Provides a description in the DAP2 protocol of the "shape" of data in a database, using a vaguely C-like syntax.
-
DAS (Data Attribute Structure): Similar to a DDS but contains information about the data, such as units and the name of the variable. Used only in the DAP2 protocol.
2. Which DAP Protocol should I use to access/serve data?
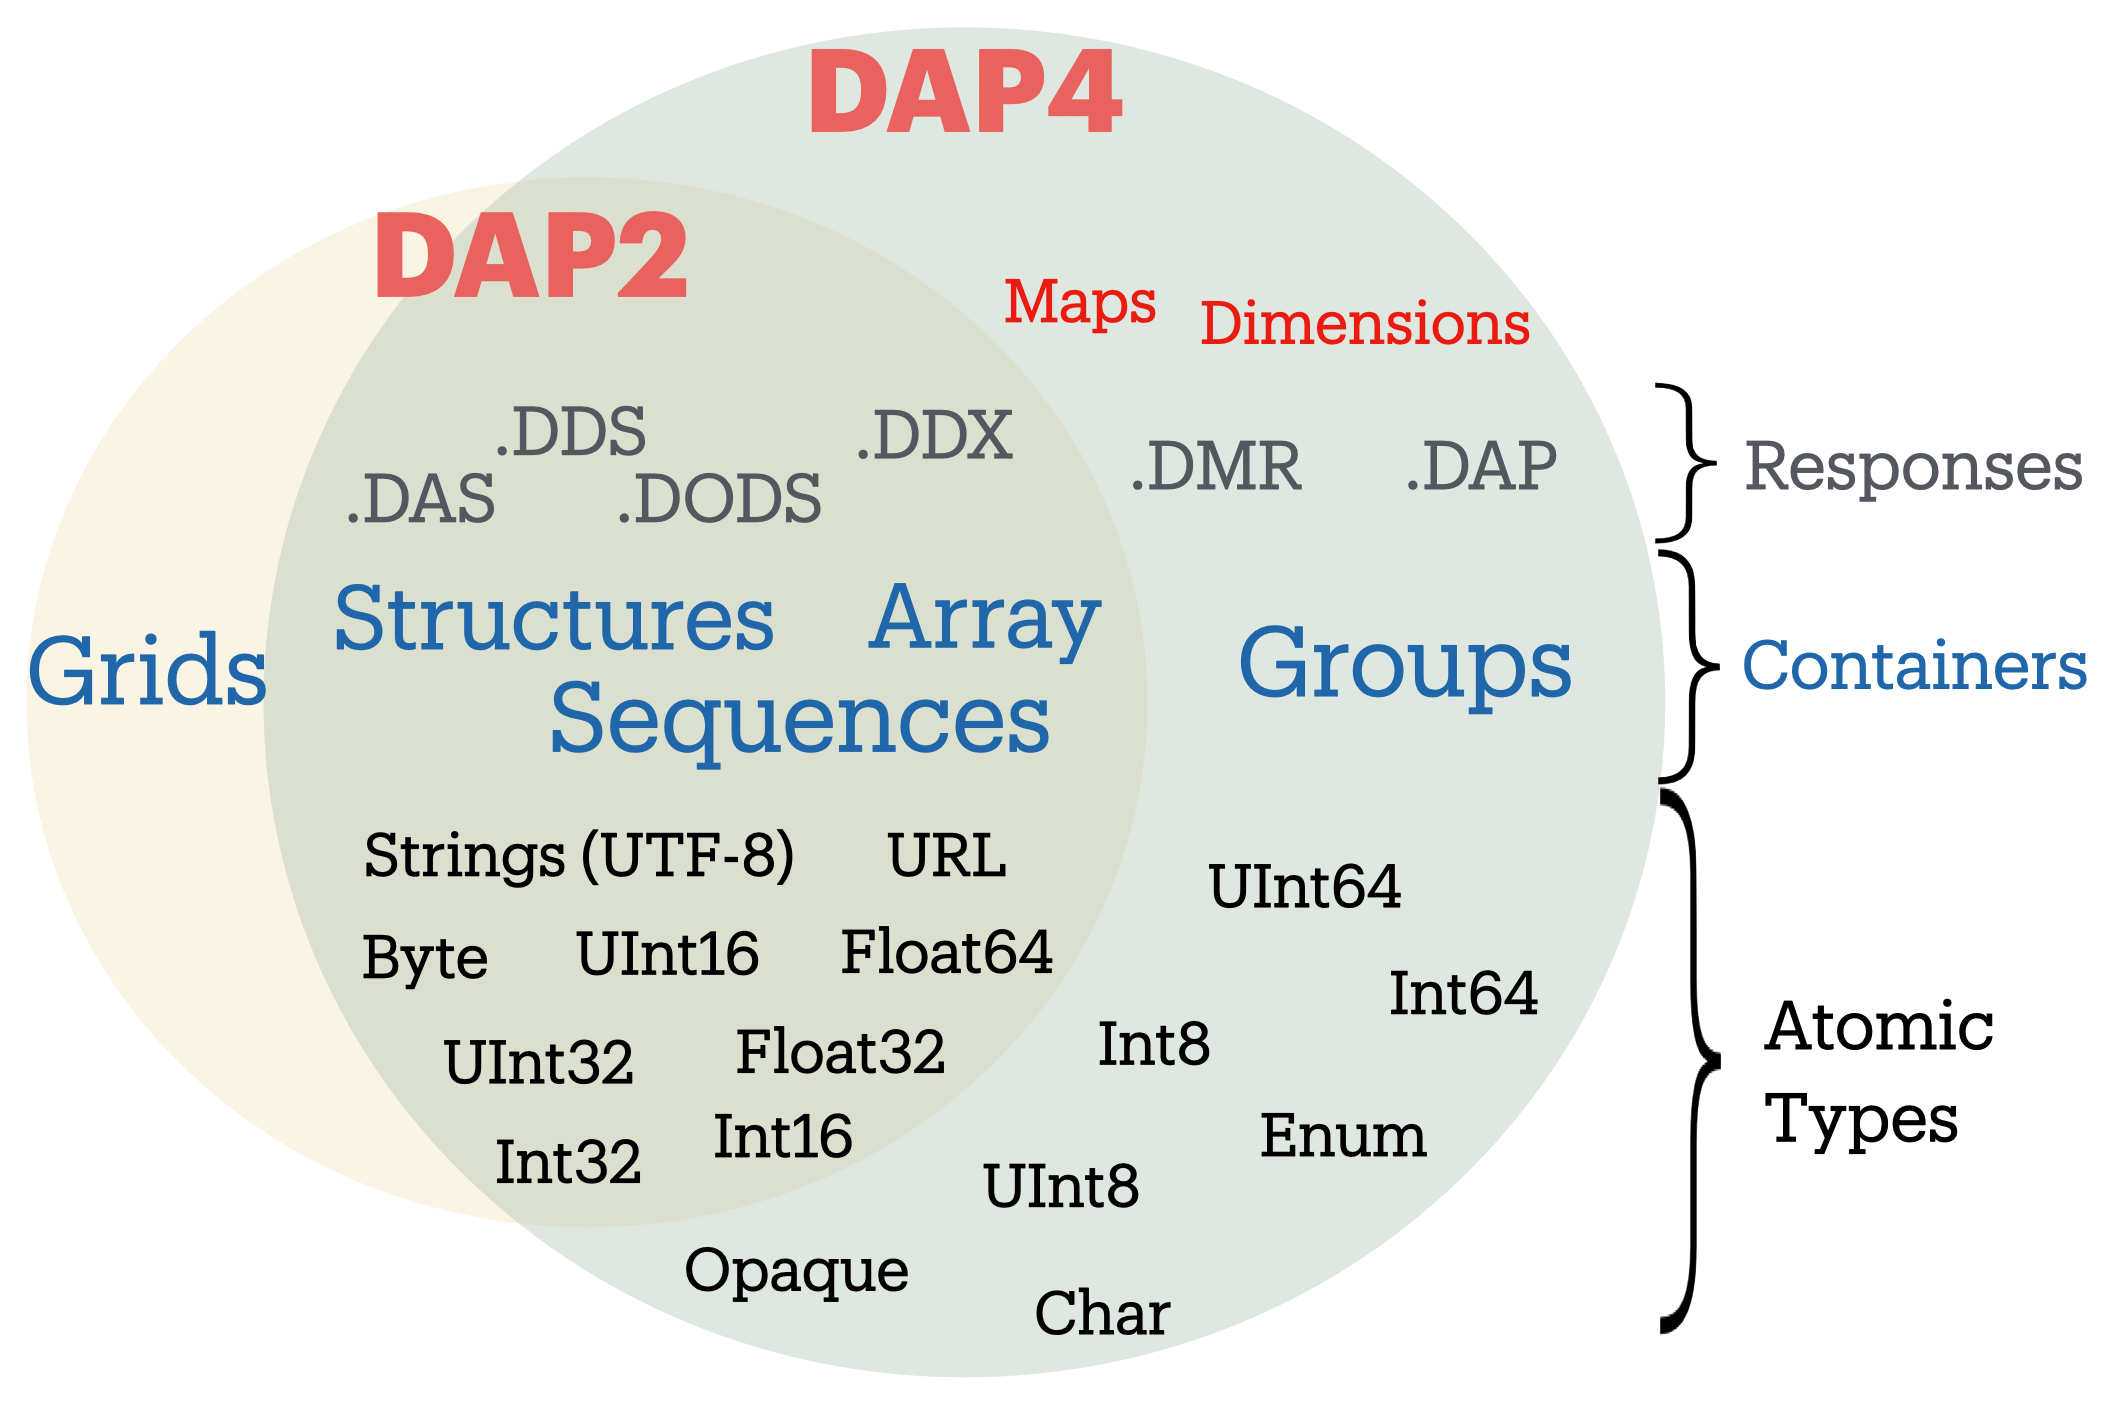
There are many differences between the DAP2 and DAP4 protocol, and we refer to the
DAP4 specification for an in-depth
look at what these are. Broadly speaking, the DAP4 data model is close to a superset of
DAP2, meaning any data file that can be transmitted via the DAP2 (DODS) protocol, CAN
BE transmitted via the DAP4 protocol. And despite the fact that Grids are no longer part
of DAP4 (see Figure 1), any Array represented in the DAP2 data model
as a Grid IS represented as an Array in the DAP4 data model. However, any DAP4 dataset
that contains atomic types (e.g. an attribute or a variable) or container types that are
NOT part of the DAP2 data model (i.e. a Group), will NOT be able to be represented by the DAP2 model and the transmition via DAP2 protocol will fail.
|
Note
|
It is possible that DAP2 protocol will transmit datasets with missing attributes,
when these attributes have atomic types beyond the scope of the DAP2 data model (e.g. Char,
Int64, etc; see Figure 1).
|
We strongly recommend users to adopt the DAP4 Protocol. Any Hyrax data server that implements the DAP4 protocol CAN produce DAP2 responses. This means that any existing data user with an access client API that is only compatible with the DAP2 protocol (DDS/DAS), will still be able to access data from a DAP4 implementing Hyrax data server, as long as the data file contains types within the scope of the DAP2 data model.
3. What to do With an OPeNDAP URL
Suppose someone gives you a hot tip that there is a lot of good data at…
http://test.opendap.org:8080/opendap/atlas03/ATL03_20181228015957_13810110_003_01.h5
This URL points to Level 2 data from the Advanced Topographic Laser Altimeter (ATLAS) instrument above the Ice, Cloud, and land Elevation Satellite-2 (ICESat-2). This particular file from the ATLAS03 was created by NASA in 2021, and has over 80 Groups with many variables inside.
The simplest thing you can is to download the data to which the URL points or you could append .ascii and feed the URL to a regular web browser. However, the file may contain data that is too big to perform simple exploratory analysis using any of the two mentioned approaches.
Another option is to use a Client API of your preference, that can parse the DMR response. Packages and applications like PyDAP, Ferret, and MATLAB, have long included support for parsing DAP responses. But this approach works best when the remote dataset has few variables, i.e. less than 5, and when the DMR is relatively small. Many datasets produced by NASA, NOAA, can have 100s of variables, with many nested Groups, which all make parsing of the DAP response slower, and it also takes long time for the Client API to parse the DMR. Just opening such files (lazily) can be huge bottleneck for many users, even more when attempting to read multiple files in parallel, each file with 100s of variables.
Instead, OPeNDAP has long supported METADATA inspection of remote datasets via Data Request Forms.
|
Note
|
Because you will rarely want to request an entire archive, OPeNDAP provides sophisticated sub-sampling capabilities, and you need to know something about the data in order to use them. |
|
Note
|
For more advanced users, we also recommend checkout out the tutorials documents to check more advanced Python cases, as well as the section on Authentication. |
3.1. An Easy Way: Using the Browser-Based OPeNDAP Server Dataset Request Form
OPeNDAP includes a way to sample data that makes writing a constraint expression somewhat easier than using only a URL to do the same thing. Append .dmr.html to an OPeNDAP URL, and you will get an OPeNDAP Server DAP4 Dataset Request Form that simplifies the process for sampling data.
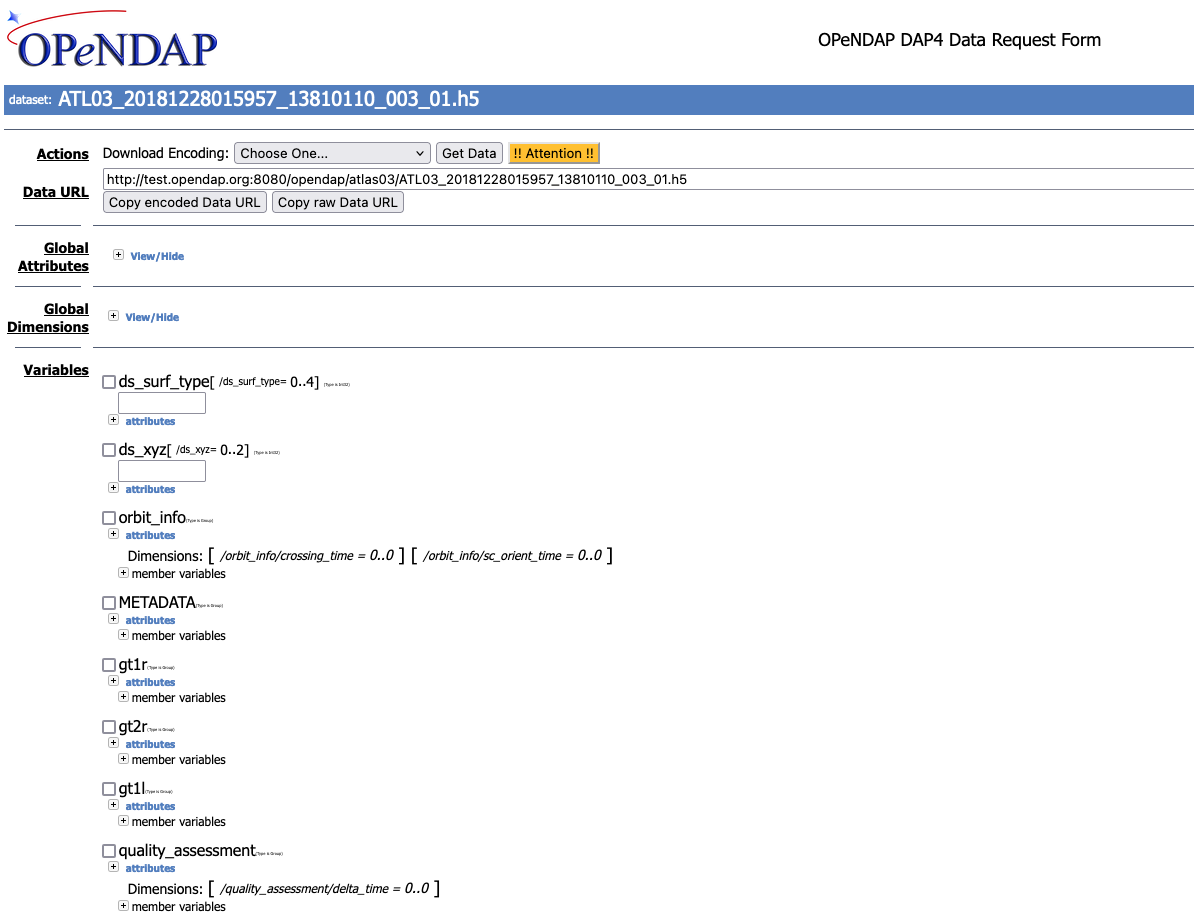
The OPeNDAP Server DAP4 Dataset Request Form has four main sections. To learn more about the basic Data Request form go to OPeNDAP Website Resource.
The DAP4 Request Form allows one to inspect the entire dataset, all variables, its medatada, their size, and importantly it can allow users to subset the dataset close to the data. OPeNDAP servers are specialized in subsetting close to the data, and the subsetting can be done in two different ways:
-
Reduce the number of variables (less variables)
-
Reduce the size of variables (spatial subset)
Together, these can greatly speed up the response and significantly reduce the amount of time a Client API spends parsing the DMR to represent the dataset for exploration.
The DAP4 Request Form has an interactive feature to build a new URL that represents the
subset dataset. For example, consider that you are only interested in plotting one of the track
as a function of time. Say Data within the Group gt3r, and within it the time, longitude and
latitude within the heights subgroup. You check the boxes related the three variables
of interest, with their following Fully Qualifying Names:
/gt3r/heights/delta_time
/gt3r/heights/lat_ph
/gt3r/heights/lon_ph
And the resulting URL on the DataURL box becomes:
dataURL + ?dap4.ce=/gt3r/heights/delta_time[0:1:4548381];/gt3r/heights/lat_ph[0:1:4548381];/gt3r/heights/lon_ph[0:1:4548381]|
Note
|
the + in the URL above implies concatenation of the two strings. One can also ommit the hyperslabs in the Constraint Expression: ?dap4.ce=/gt3r/heights/delta_time;/gt3r/heights/lat_ph;/gt3r/heights/lon_ph. The semi-colon ; is used to separate variable names. The two options are identicals. The hyperslab allows for spatial subsetting, but the square brackets NEED to be ESCAPED by Client APIs. PyDAP, for example, does that.
|
The URL above is the original URL plus a Constraint Expression (CE). You can pass that URL to a client API (like PyDAP) and it will request from Hyrax the (much reduced) DMR associated only with these three variables.
The OPeNDAP Server Dataset Request Form works for sequence data as well as grids. However, since sequence constraint expressions look different from grid expressions, the form also looks slightly different. The variable selection boxes allow you to enter relational expressions for each variable. Apart from that, the function is exactly the same.
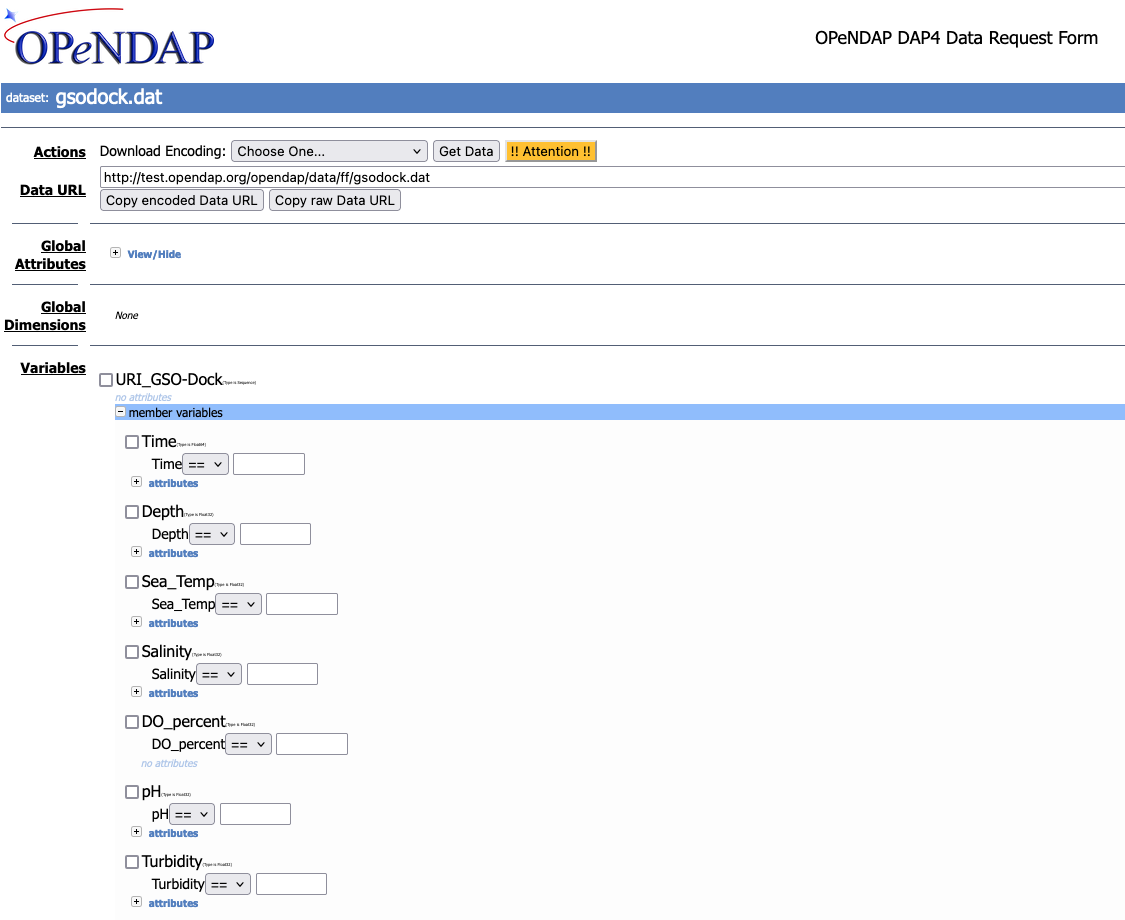
Click the checkboxes to choose which data types you want returned, and then add constraint expressions as desired. The data file contains a day’s record of changing water properties off a dock in Rhode Island. If you click the Depth and Time boxes (as in the figure 3), you will get a record of the tide going in and out twice. You can add conditions by entering values in the text boxes. See what you get when you limit the selection to records where the Depth is greater than 2 meters.
3.2. A More Flexible Way: Using Commands in a Browser
If you would prefer to not use the OPeNDAP Server Data Access Form, you can use just a browser instead. This section describes how to do that.
OPeNDAP has sophisticated methods for subsampling data at a remote site, but you need some information about the data first. First, we will look at data’s DMR. This provides a description of the "shape" of the data, types, and attributes. You get a dataset’s DMR by appending .dmr.xml to the URL, which is an xml document.
|
Note
|
The xml is a interactive document that allows to click and collapse the information on the DMR. Figure 4 has all the nodes associated with Attributes collapsed. |
For example, consider the much simpler Reynolds Dataset from NOAA, describing mean sea surface temperature. Click
here to see
an example of an OPeNDAP DMR for the REYNOLDS Dataset
at sst.mnmean.nc.gz.dmr.xml. The (collapsed) DMR looks like this:
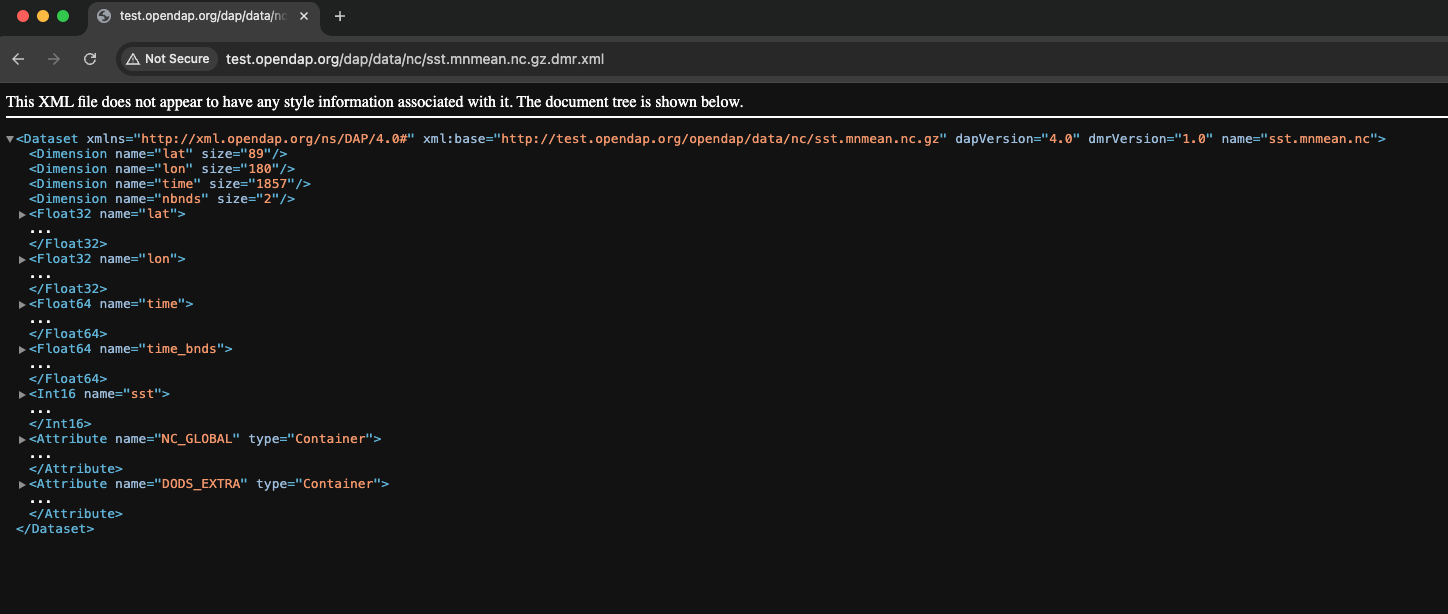
From the sst.mnmean.nc.gz DMR in Figure 4, you can see that the dataset consists of:
-
Dataset declaration.
-
Dimensions declaration by their name and size
-
Numeric types of the Array data with appropriate Dimension and Attribute declarations in their nodes (not visible on Figure 4).
-
Global Attributes declaration.
The DMR in Figure 4 broadly allows another interactive inspection of a remote dataset.
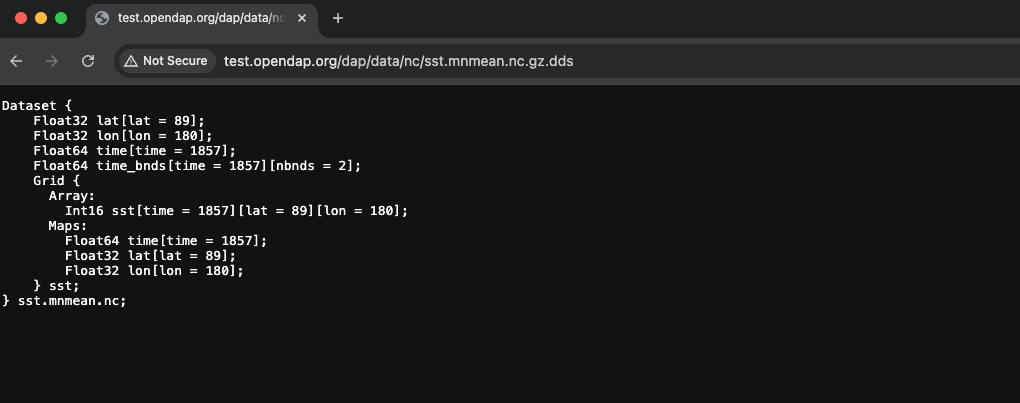
Note that the same dataset can be represented by the same DAP4 server as a Grid by adding
a .dds at the end of the URL
Continuing with the DMR, we can inspect the response to a URL with a Constraint Expression.
This allows us to quickly verify that the resulting DMR represents only the data we
are interesed. For example, say we are only interested in sea surface temperature (sst).
The URL with the constraint expression, along with the added .dmr.xml is:
http://test.opendap.org/dap/data/nc/sst.mnmean.nc.gz.dmr.xml?dap4.ce=/sstThis URL on a browser results in the DMR shown in Figure 6.
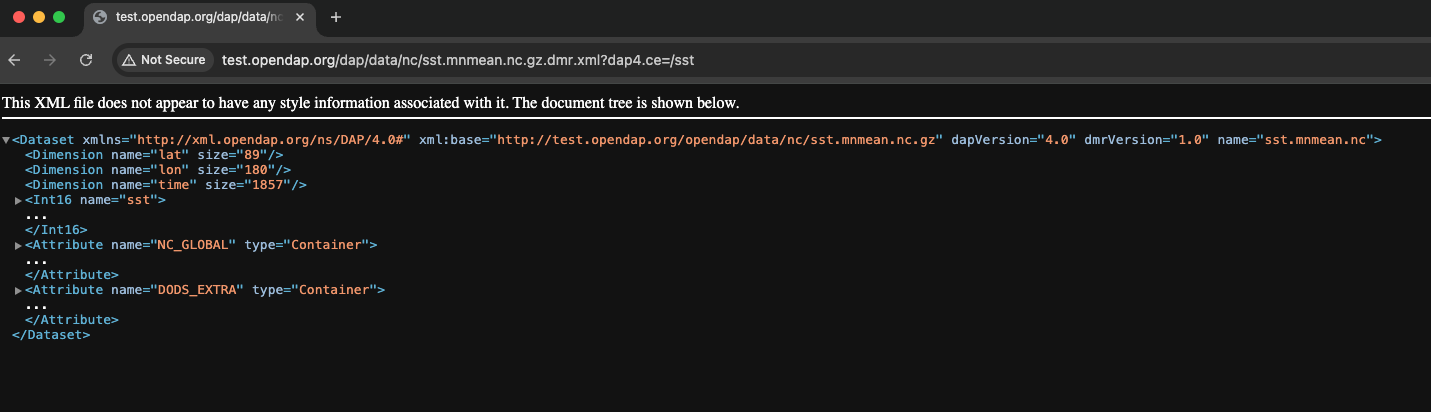
sst and the attributes of the dataset.A savvy User can now use the client API along with the above Constrained URL, to speed up their exploration and analysis.
Lastly, going back to the original ATLAS03 dataset with over 80 Groups, and many more variables
referenced in Figure 2, the CE to discard all variables except delta_time, lon_ph and lat_ph from the response, yields the following (XML) DMR
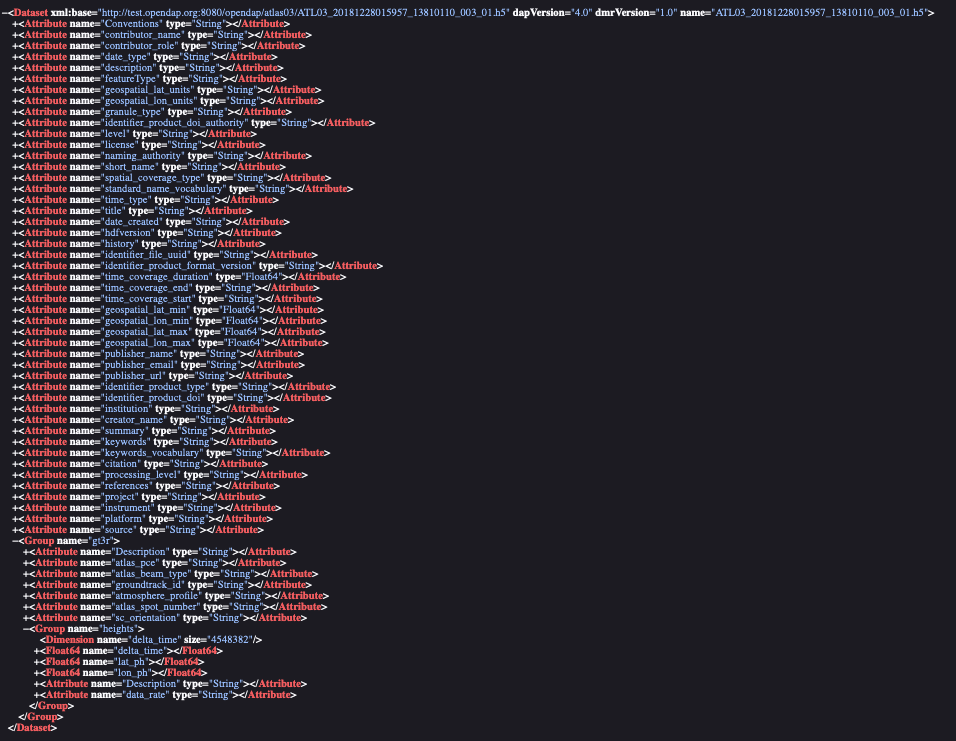
/gt3r/heights/ (in this case we use the firefox browser which allows a more collapsable view of the DMR than Google Chrome)A Client API such as will parse much faster such response, as compared to the original dataset.
To learn more about Constraint Expressions on the DAP4 data model, check out the DAP4 specification
3.2.1. Peeking at Data
Now that we know a little about the shape of the data and the data attributes, we will look at some of the data.
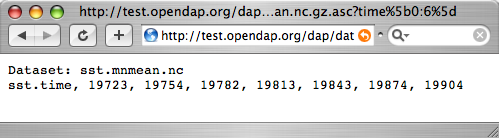
You can request a piece of an array with subscripts, just like in a C program, Matlab, or many other computer languages. Use a colon to indicate a subscript range. For example, http://test.opendap.org/dap/data/nc/sst.mnmean.nc.gz.ascii?time[0:6] will produce a time vector that looks like this:
time variable is requested by the CE.If you are interested in the Reynolds dataset, you are probably more interested in the sea surface temperature data than the dependent variable vectors. The temperature data is a three-dimensional grid. To sample the sst grid, you just add a dimension for time: "…sst/mnmean.nc.ascii?sst[0:1][13:16][103:105]". Click here to see this example in action. You will see something like this:
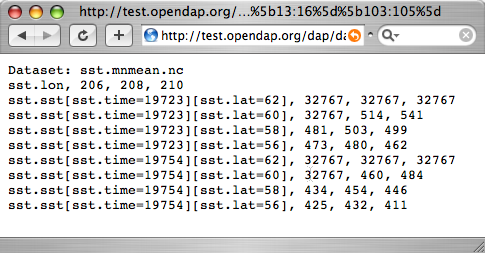
sst variable is requested by the CE.Notice that when you ask for part of an OPeNDAP grid, you get the array part along with the corresponding parts of the map vectors.
One potentially confusing thing about our request is that we requested the time, latitude, and longitude by their position in the map vectors, but in the returned information they are referenced by their values. That is, we asked for the 0th and 1st time values, but these are 19723 and 19754. We also asked for the 103rd, 104th, and 105th longitude values, but these are 206, 208, and 210 degrees, respectively. The value 434 in the return can be referenced as "…sst/mnmean.nc.ascii?sst[1][15][103]". Click here to see this in action.
Note that the sst values are in Celsius degrees multiplied by 100, as indicated by the scale_factor attribute of the DAS. Further, it’s important to remember that with this dataset the data were obtained by calculating spatial and temporal means. Consequently, the data points in the sst array should be ignored when the value is the missing data flag (32767) as these pixels are probably coincident with land (although there can be other reasons for missing data).
Server Functions: Looking at Geo-Referenced Data Using Hyrax
There are a number of different DAP servers that have been developed by different organizations. Hyrax, the DAP server developed by the OPeNDAP group, supports access to geo-referenced data using lat/lon coordinates. You probably noticed that the array and grid indexes used so far are not very intuitive. You can see the data are global and are indexed by latitude and longitude, but in the previous example we first looked at the lat and lon vectors, saw which indexes corresponded to which real-world locations, and then made our accesses using those indexes.
Hyrax supports a small set of functions which can perform these look-up operations for you. For example, we could rewrite the example above like this: "…sst/mnmean.nc.gz.ascii?geogrid(sst,62,206,56,210,"19722<time<19755")". Click here to see this in action. The results look like this:
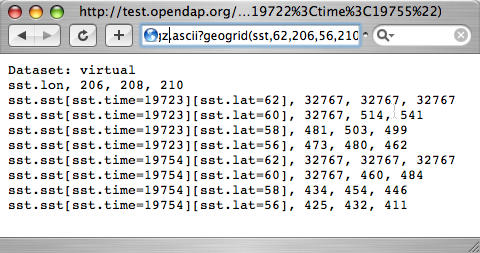
geogrid().The Syntax for geogrid() is: "geogrid(grid variable, upper latitude, left longitude, lower latitude,
right longitude, other expressions)", where other expressions must be enclosed in double quotes, and can be one of these forms:
-
variable relop value
-
value relop variable
-
value relop variable relop value
Relop stands for one of the relational operators: <,>,⇐,>=,=,!=. Value stands for a numeric constant, and Variable must be the name of one of the grid dimensions. You can use multiple clauses by separating them with commas, but each clause must be surrounded by double quotes. For example, the following is yet another way to get the same return data as the above example:
You can figure out which functions are supported by Hyrax by calling the server function version(). This will return an XML document that shows each registered function and its version.
To find out how to call each function, you can call it with an empty parameter list and get some documentation for that function. For example, try …?geogrid().
|
Note
|
Other severs, such as ERDAP, support alternative ways of doing similar operations. |
Creating Server Function Pipelines
Server functions can be composed to form pipelines, feeding the value of one function to another. Since the values in this data set are scaled up by a factor of 100, we can use the linear_scale() function to scale the result using…
y = mx + b
…where m is the scale factor and b offset. The linear_scale() function syntax is:
-
linear_scale(variable, scale factor, offset)
-
linear_scale(variable)
Use the first form when you want to specify m and b explicitly or the second form when Hyrax can guess the values using data set metadata. (Note: You will get an error if the server cannot figure out value to use). For example,
…nc.gz.ascii?linear_scale(geogrid(sst produces the following:
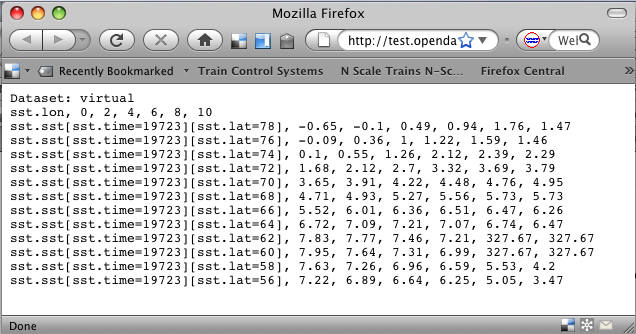
geogrid() and use linear_scale as Server Side Functions.3.2.2. Working With Sequence Data
Gridded data works well for satellite images, model data, and data compilations such as the Reynolds data we have just looked at. Other data, such as data measured at a specific site, are not so readily stored in that form. OPeNDAP provides a data type called a "sequence" to store this kind of data.
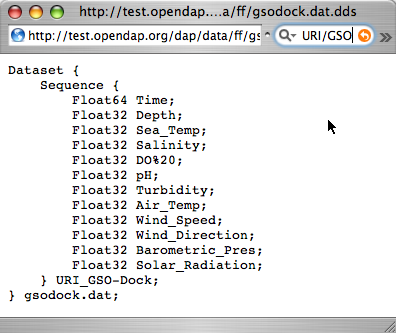
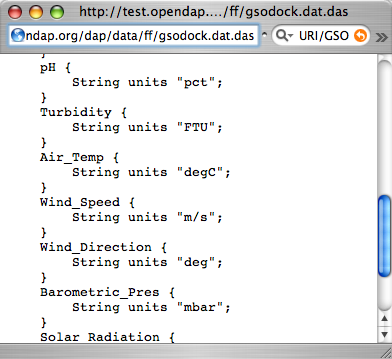
A sequence can be thought of as a relational data table, with each column representing a different data variable, and each row representing a different measurement of a set of values (also called an "instance"). For example, an ocean temperature profile can be stored as a Sequence with two columns: pressure and temperature. Each measurement is a pressure and a temperature and is contained in one row. A weather station’s data can be stored as a sequence with time in one column and each weather variable in another column. You can find a good example of a sequence at http://test.opendap.org/dap/data/ff/gsodock.dat
This is a 24-hour record of measurements at a weather station on a dock in Rhode Island. Each record consists of a dozen different variables, including air temperature, wind speed, and direction, as well as depth, temperature, and water salinity The data is arranged into 144 measurements of each of the twelve variables.
Ask for the DDS, and you will see the twelve variables, all contained in a Sequence called URI_GSO-Dock:
The DAS contains the units for each data type and some additional information:
To select the data you want from a server, use a constraint expression, just as you did with the gridded data above. Now, though, the constraint contains two kinds of clauses. One is a list of variables you wish to have returned (the projection clause), and the other is the conditions under which they should be returned (the selection clause). For example, if you want to see salinity data read after noon that day, try this:
Selection clauses can be stacked endlessly against a projection clause, allowing all the flexibility most people need to sample data files. Here is an example of applying two conditions:
Try it yourself with three or four conditions or more.
4. Finding OPeNDAP URLs
Data often comes in the form of a URL enclosed in an email message, and there are several other ways to find data served by OPeNDAP servers.
4.1. Google
Use Google to search for 'OPeNDAP Hyrax' or to search for 'OPeNDAP <terms>' or 'Hyrax <terms>'. For example, Google OPeNDAP sea surface temperature.
4.2. GCMD
The Global Change Master Directory provides a huge amount of earth science data and catalogs OPeNDAP URLs for the datasets that have them. You can search on "OPeNDAP" from the main page to find many of these datasets.
If you make that search, check the list for the Reynolds data; it should be there.
4.3. Web Interface
Many sites that serve one OPeNDAP dataset also serve others. The OPeNDAP web interface (if it is enabled by the site) allows you to check the directory structure for other datasets. For example, we will look at the Reynolds data we saw previously: http://test.opendap.org/dap/data/nc/sst.mnmean.nc.gz.html
If we use the same URL, but without the file name at the end, we can browse the directory of data: http://test.opendap.org/dap/data/nc/
The OPeNDAP server checks to see whether the URL is a directory, and if it is, it generates a directory listing, like this:
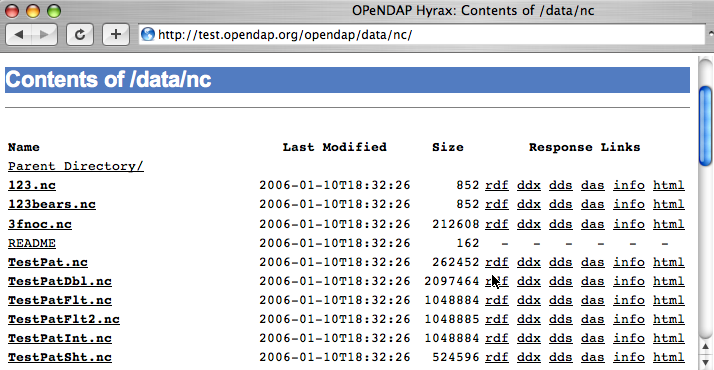
You can see from the directory listing that the monthly mean dataset that we have been looking at is accompanied by a host of other datasets. The site you are looking at is our test data sit. We use these datasets to run many of our nightly tests. All of the files in the the /data/nc directory are stored in NetCDF files; other directories under /data hold data stored in other file types.
|
Note
|
In general, this list is produced by an OPeNDAP server and this feature works on all servers. However, it only really understands OPeNDAP data files, so other file types will simply be sent without any interpretation. This can be useful if the 'other file' happens to be a README or other documentation file since this makes it simple to serve data stored in files and documented using plain text files. Essentially, the person or organization providing data does not need to do anything besides installing the server (Hyrax). |
5. Further Analysis
This guide is about forming an OPeNDAP URL. After you have figured out how to request the data, there are a variety of things you can do with it. (OPeNDAP software mentioned here is available from the OPeNDAP Home Page.)
-
Use a generic web client like geturl (a standard part of the OPeNDAP software) or free programs such as wget, curl or Chrome to download data into a local data file. To be able to use the data further, you will probably want to download the data using one of alternative response types like the ASCII version (by using the .ascii suffix on the URL, as in the examples shown above) or GeoTIFF, NetCDF3, Jpeg2000, etc., using the suffix appropriate for those formats.
-
Any tool that uses the Java- or C-NetCDF API will work with OPeNDAP. For example, Matlab has built-in support for OPeNDAP; Matlab supported NetCDF calls can be used with DAP datasets. Other tools that are built on NetCDF API also read data from OPeNDAP servers. A free tool similar to Matlab, GNU Octave, is also supported. The R Project for Statistical Computing can also read data from OPeNDAP servers. The Ferret and GrADS free data analysis packages both support OPeNDAP. You can use these for down loading OPeNDAP data and for examining it afterwards. (There are limitations. For example, Ferret may not be able to read datasets served as Sequence data.)
|
Note
|
For information about NetCDF compliant tools, see the NetCDF Compliant Tools in the User Guide. |
The use of these clients, like the ways in which you can analyze the data you find, is beyond the scope of this document.